Blackbox Exporter 小記
在用 Prometheus + Grafana 監控自家服務的同時,我們也會想用同一套系統去監控第三方服務。
本文介紹一個好用的 Prometheus 官方工具:Blackbox exporter,可以省下手刻 curl 腳本的工夫。我也順便介紹一些踩過的雷。
健康狀況的揭露方式
第三方服務的健康狀況,有不同的自我揭露方式:
-
API:像 Google Cloud 有提供 json endpoint。
-
Feed:像 AWS 有提供 RSS feed,Google Cloud 有 RSS feed,Stripe 有 Twitter @stripestatus 及 RSS feed。
-
網頁:像 AWS 有提供 Service Health Dashboard 網頁,Google Cloud 有 Status Dashboard 網頁,Stripe 有 System Status 網頁。
-
統包服務:像 Pingdom、Downdetector 可以一站通吃想監控的第三方服務群。
-
不完全揭露。
針對這些林林總總的揭露方式,Blackbox exporter 提供幾種 prober:http_probe、 tcp_probe、dns_probe、icmp_probe,即使面對「不完全揭露」自身健康狀況的第三方服務,還是可以在某些程度上間接採集他們的健康狀況,只要你留意這個「採集」的舉動沒有副作用。
Blackbox exporter 分工架構
在 Prometheus 微服務架構中,是讓各種 exporter 先去 probe 各自責任區內的 metrics,再讓 Prometheus 透過 HTTP 去 scrape 這些 exporter 採集到的 metrics。
基於這個分工體系,Blackbox exporter 負責去 probe 第三方服務的健康狀況,再提供一個 /probe 介面讓 Prometheus 去蒐集匯總 metrics。
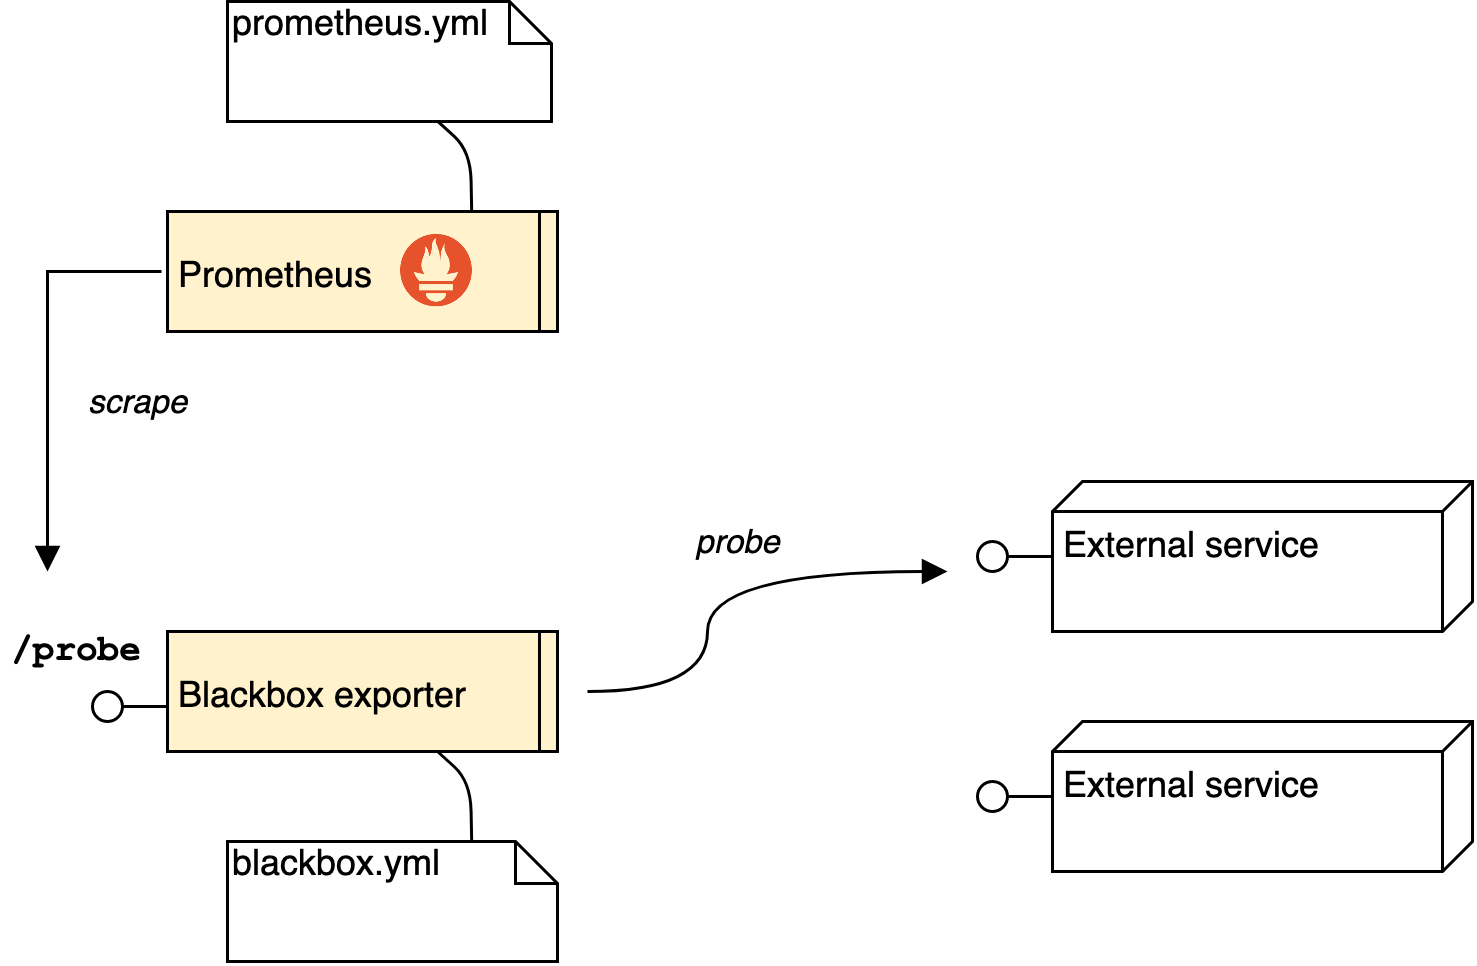
所以,一開始,我們會先試著寫好 blackbox.yml 設定檔,先測試 Blackbox exporter 能正常運作,之後才去串接 Prometheus。
Blackbox exporter 初體驗
官方提供的陽春版 blackbox.yml 設定檔展示了一些常見的 blackbox exporter 模組 (module),很適合初次上手之用:
# https://github.com/prometheus/blackbox_exporter/blob/master/blackbox.yml
modules:
  http_2xx:
    prober: http
  http_post_2xx:
    prober: http
    http:
      method: POST
  #...
其中,最常用的應該是 http_2xx 模組了。如果你只需要用到這模組,可以不必準備 blackbox.yml 設定檔。
我們可以先下載並啟動 Blackbox exporter:
$ ./blackbox_exporter預設情況下,Blackbox exporter 會透過 port 9115 提供探測服務。
現在,讓我們透過 Blackbox exporter 內建的 http_2xx 模組,探測 github.com 的健康狀況:
$ curl 'localhost:9115/probe?target=github.com&module=http_2xx'或是乾脆省略掉預設的 http_2xx 模組名稱:
$ curl 'localhost:9115/probe?target=github.com'透過 Blackbox exporter 探測 github.com 的輸出結果
# HELP probe_dns_lookup_time_seconds Returns the time taken for probe dns lookup in seconds
# TYPE probe_dns_lookup_time_seconds gauge
probe_dns_lookup_time_seconds 0.057117535
# HELP probe_duration_seconds Returns how long the probe took to complete in seconds
# TYPE probe_duration_seconds gauge
probe_duration_seconds 1.833592006
# HELP probe_failed_due_to_regex Indicates if probe failed due to regex
# TYPE probe_failed_due_to_regex gauge
probe_failed_due_to_regex 0
# HELP probe_http_content_length Length of http content response
# TYPE probe_http_content_length gauge
probe_http_content_length -1
# HELP probe_http_duration_seconds Duration of http request by phase, summed over all redirects
# TYPE probe_http_duration_seconds gauge
probe_http_duration_seconds{phase="connect"} 0.425883281
probe_http_duration_seconds{phase="processing"} 0.433015322
probe_http_duration_seconds{phase="resolve"} 0.086735632
probe_http_duration_seconds{phase="tls"} 0.443000784
probe_http_duration_seconds{phase="transfer"} 0.663546262
# HELP probe_http_redirects The number of redirects
# TYPE probe_http_redirects gauge
probe_http_redirects 1
# HELP probe_http_ssl Indicates if SSL was used for the final redirect
# TYPE probe_http_ssl gauge
probe_http_ssl 1
# HELP probe_http_status_code Response HTTP status code
# TYPE probe_http_status_code gauge
probe_http_status_code 200
# HELP probe_http_uncompressed_body_length Length of uncompressed response body
# TYPE probe_http_uncompressed_body_length gauge
probe_http_uncompressed_body_length 137503
# HELP probe_http_version Returns the version of HTTP of the probe response
# TYPE probe_http_version gauge
probe_http_version 1.1
# HELP probe_ip_addr_hash Specifies the hash of IP address. It's useful to detect if the IP address changes.
# TYPE probe_ip_addr_hash gauge
probe_ip_addr_hash 2.436894991e+09
# HELP probe_ip_protocol Specifies whether probe ip protocol is IP4 or IP6
# TYPE probe_ip_protocol gauge
probe_ip_protocol 4
# HELP probe_ssl_earliest_cert_expiry Returns earliest SSL cert expiry in unixtime
# TYPE probe_ssl_earliest_cert_expiry gauge
probe_ssl_earliest_cert_expiry 1.652184e+09
# HELP probe_ssl_last_chain_expiry_timestamp_seconds Returns last SSL chain expiry in timestamp seconds
# TYPE probe_ssl_last_chain_expiry_timestamp_seconds gauge
probe_ssl_last_chain_expiry_timestamp_seconds 1.652184e+09
# HELP probe_success Displays whether or not the probe was a success
# TYPE probe_success gauge
probe_success 1
# HELP probe_tls_version_info Contains the TLS version used
# TYPE probe_tls_version_info gauge
probe_tls_version_info{version="TLS 1.3"} 1
~ % curl 'localhost:9115/probe?target=github.com&module=http_2xx'
# HELP probe_dns_lookup_time_seconds Returns the time taken for probe dns lookup in seconds
# TYPE probe_dns_lookup_time_seconds gauge
probe_dns_lookup_time_seconds 0.025288617
# HELP probe_duration_seconds Returns how long the probe took to complete in seconds
# TYPE probe_duration_seconds gauge
probe_duration_seconds 1.776282033
# HELP probe_failed_due_to_regex Indicates if probe failed due to regex
# TYPE probe_failed_due_to_regex gauge
probe_failed_due_to_regex 0
# HELP probe_http_content_length Length of http content response
# TYPE probe_http_content_length gauge
probe_http_content_length -1
# HELP probe_http_duration_seconds Duration of http request by phase, summed over all redirects
# TYPE probe_http_duration_seconds gauge
probe_http_duration_seconds{phase="connect"} 0.414948208
probe_http_duration_seconds{phase="processing"} 0.42066351300000004
probe_http_duration_seconds{phase="resolve"} 0.038381098
probe_http_duration_seconds{phase="tls"} 0.465243547
probe_http_duration_seconds{phase="transfer"} 0.65392713
# HELP probe_http_redirects The number of redirects
# TYPE probe_http_redirects gauge
probe_http_redirects 1
# HELP probe_http_ssl Indicates if SSL was used for the final redirect
# TYPE probe_http_ssl gauge
probe_http_ssl 1
# HELP probe_http_status_code Response HTTP status code
# TYPE probe_http_status_code gauge
probe_http_status_code 200
# HELP probe_http_uncompressed_body_length Length of uncompressed response body
# TYPE probe_http_uncompressed_body_length gauge
probe_http_uncompressed_body_length 137509
# HELP probe_http_version Returns the version of HTTP of the probe response
# TYPE probe_http_version gauge
probe_http_version 1.1
# HELP probe_ip_addr_hash Specifies the hash of IP address. It's useful to detect if the IP address changes.
# TYPE probe_ip_addr_hash gauge
probe_ip_addr_hash 1.664977422e+09
# HELP probe_ip_protocol Specifies whether probe ip protocol is IP4 or IP6
# TYPE probe_ip_protocol gauge
probe_ip_protocol 4
# HELP probe_ssl_earliest_cert_expiry Returns earliest SSL cert expiry in unixtime
# TYPE probe_ssl_earliest_cert_expiry gauge
probe_ssl_earliest_cert_expiry 1.652184e+09
# HELP probe_ssl_last_chain_expiry_timestamp_seconds Returns last SSL chain expiry in timestamp seconds
# TYPE probe_ssl_last_chain_expiry_timestamp_seconds gauge
probe_ssl_last_chain_expiry_timestamp_seconds 1.652184e+09
# HELP probe_success Displays whether or not the probe was a success
# TYPE probe_success gauge
probe_success 1
# HELP probe_tls_version_info Contains the TLS version used
# TYPE probe_tls_version_info gauge
probe_tls_version_info{version="TLS 1.3"} 1
大部分情況下,我們只需要看其中的 probe_success 這項 gauge 指標:
# HELP probe_success Displays whether or not the probe was a success
# TYPE probe_success gauge
probe_success 1
請用 Blackbox exporter 去戳戳看其他網站吧。
IPv6/IPv4 問題
如果用 Blackbox exporter 去探測 google.com,會得到很奇怪的結果:
$ curl 'localhost:9115/probe?target=google.com'

[略]
# HELP probe_ip_protocol Specifies whether probe ip protocol is IP4 or IP6
# TYPE probe_ip_protocol gauge
probe_ip_protocol 6
# HELP probe_success Displays whether or not the probe was a success
# TYPE probe_success gauge
probe_success 0
打開 debug 模式查查看:
$ curl 'localhost:9115/probe?target=google.com&debug=true'

Logs for the probe:
ts=2020-08-07T07:42:43.560461Z caller=main.go:304 module=http_2xx target=google.com level=info msg="Beginning probe" probe=http timeout_seconds=119.5
ts=2020-08-07T07:42:43.561257Z caller=http.go:323 module=http_2xx target=google.com level=info msg="Resolving target address" ip_protocol=ip6
ts=2020-08-07T07:42:43.573101Z caller=http.go:323 module=http_2xx target=google.com level=info msg="Resolved target address" ip=2404:6800:4008:801::200e
ts=2020-08-07T07:42:43.57317Z caller=client.go:252 module=http_2xx target=google.com level=info msg="Making HTTP request" url=http://[2404:6800:4008:801::200e] host=google.com
ts=2020-08-07T07:42:43.573276Z caller=main.go:119 module=http_2xx target=google.com level=error msg="Error for HTTP request" err="Get \"http://[2404:6800:4008:801::200e]\": dial tcp [2404:6800:4008:801::200e]:80: connect: no route to host"
[略]
從上面的 log 可看到,Blackbox exporter 試圖透過 IPv6 連線到 google.com,導致錯誤。
Prometheus 核心成員 Brian Brazil 在 “Checking for HTTP 200s with the Blackbox Exporter” 文章說明這問題的原因及解法:
You may see a surprising failure if you don’t have a working IPv6 setup, as the Blackbox exporter will prefer an IPv6 address if one is returned by DNS.
You can adjust this behaviour by adding
preferred_ip_protocol: "ip4"to the module’s configuration.
所以,我會在 blackbox.yml 設定檔當中,增加另一個模組,取一個好記的名字:
modules:
  # module: expect http_2xx, with ip4
  http_2xx_with_ip4:
    prober: http
    timeout: 5s
    http:
      preferred_ip_protocol: "ip4"

  #...
然後,重啟 Blackbox exporter,記得要餵給它新的設定檔:
$ ./blackbox_exporter --config.file=./blackbox.yml這次,讓我們改用新增的模組去探測 google.com:
$ curl 'localhost:9115/probe?target=google.com&module=http_2xx_with_ip4'這次,總算可以看到正常的 probe_success 了:
# HELP probe_ip_protocol Specifies whether probe ip protocol is IP4 or IP6
# TYPE probe_ip_protocol gauge
probe_ip_protocol 4
# HELP probe_success Displays whether or not the probe was a success
# TYPE probe_success gauge
probe_success 1
Auth
某些第三方服務的 HTTP 端點需要夾帶 auth 相關欄位。
像 Stripe API 文件就說:
Authentication to the API is performed via HTTP Basic Auth. Provide your API key as the basic auth username value. You do not need to provide a password.
If you need to authenticate via bearer auth (e.g., for a cross-origin request), use
-H "Authorization: Bearer sk_test_4eC39HqLyjWDarjtT1zdp7dc"instead of-u sk_test_4eC39HqLyjWDarjtT1zdp7dc.
那麼,這段 auth 資訊該放到 prometheus.yml 還是 blackbox.yml 設定檔?畢竟與 basic_auth 相關的設定內容,在 Prometheus 設定文件及 Blackbox exporter 設定文件都出現過。
動手實驗看看吧!
實驗程式放在 https://github.com/William-Yeh/blackbox-exporter-demo
實驗所需環境:
- Docker 19.03.12 以上。
- Docker Compose 1.26.2 以上。
我設計了兩個 Prometheus job,分別對應到兩種不同的 basic_auth 擺放位置:
| Prometheus Job | prometheus.yml | blackbox.yml |
|---|---|---|
| stripe-healthcheck | ✓ basic_auth | |
| stripe-healthcheck-wrong-config | ✓ basic_auth |
一切準備就緒,來試試看哪一種寫法才是對的吧。
請用 Docker Compose 執行:
$ docker-compose up請用瀏覽器打開 http://localhost:9090/ 進入 Prometheus 儀表板:
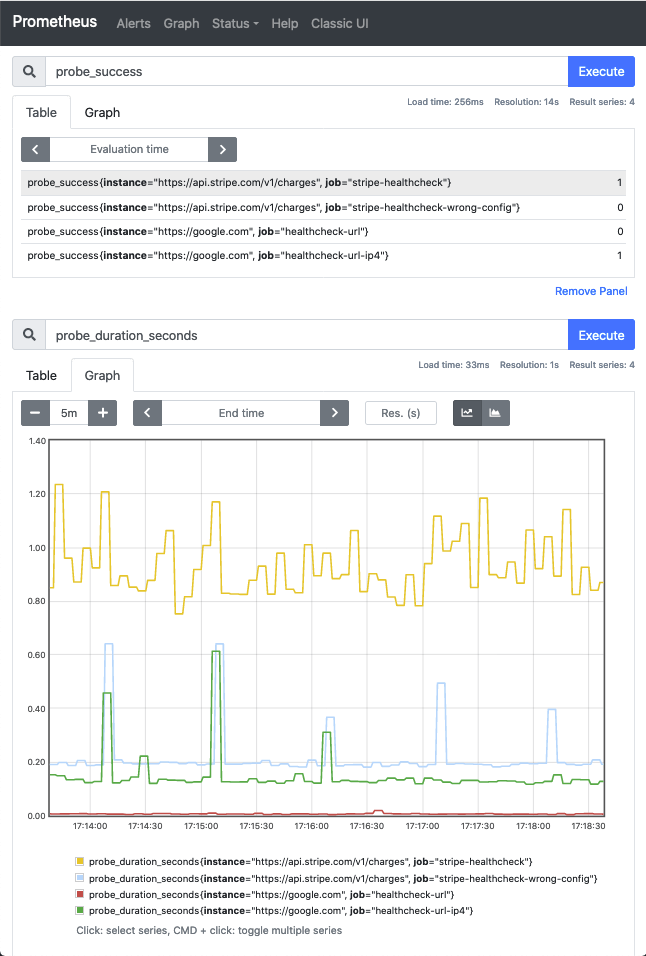
事實證明,stripe-healthcheck-wrong-config 這一組的寫法是錯誤的,要學 stripe-healthcheck 這一組將 basic_auth 擺到 blackbox.yml 裡面才對。
這是我踩過的雷。
參考資料
Blackbox exporter 並不難,麻煩的是要找到好範例來偷抄。
關於 Blackbox exporter 的部份:
-
較完整的設定檔範例
關於 Prometheus 的部份: